
Interpreting Face Results

Face Results
Calculations are shown in the Results window of the STOPECALC Faces tab. The listing shows average grades for length and area-weighted assays, followed by Net Value and Equivalence.
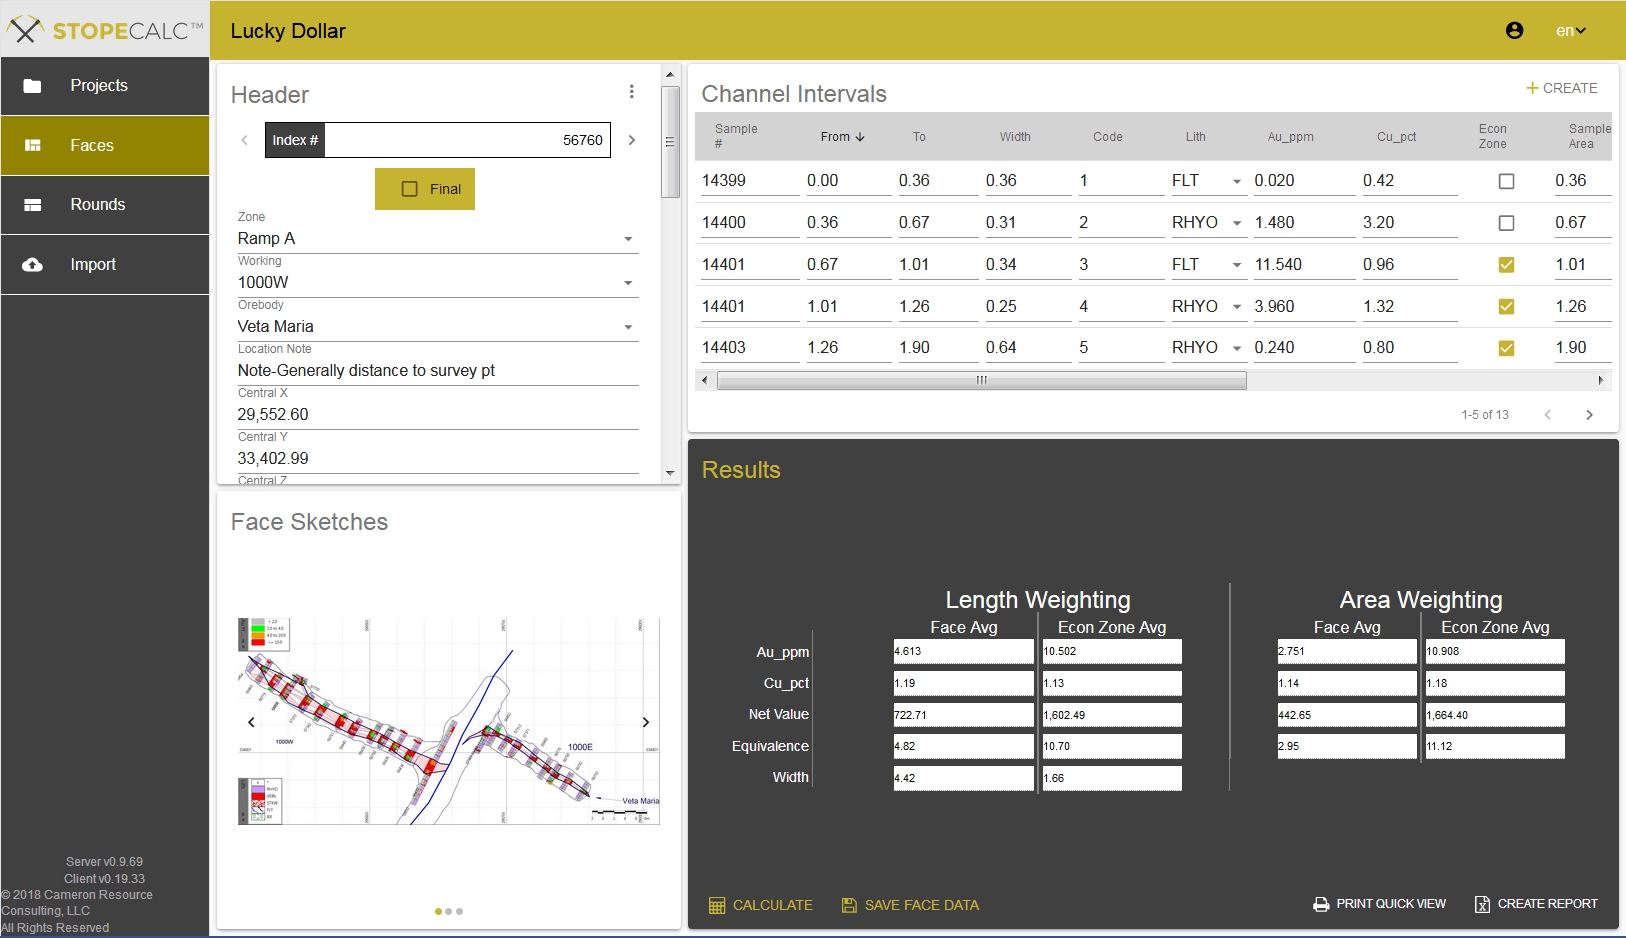
Net value is the product of the metal quantities X the metal prices X metal recoveries X metal payables specified in the Projects setup. Equivalence values are listed for the first precious metal (PM) item listed in Projects setup. If no PM's are included in the Project this field will show zeros.
For each type of weighting, the column labelled Face Avg on the left will show the results for the full face for the face width specified in the Header section to the left of the Results window. If the face width Autocalc box is selected, the face average width will equal the total length of the sample line in the Channel Intervals section. If not, and width is manually entered, the face grades will reflect dilution at zero grade in the proportion of extra width beyond the sampled width. The economic zone results in the right-hand columns of each weighting section are not affected by face width options.
To view tonnes attributable to a face based on its projection, or influence, a Quick View report or Face Report can be run. From these, dilution percentages can be derived by comparing face tonnes, grade and metal to economic zone counterparts.
Users will generally note a significant difference between length and area weighting results, especially as the structures sampled deviate from vertical (or horizontal). It is generally suboptimal to use length weighting on any veins or lenses that are inclined significantly across the face.